script
package
plot
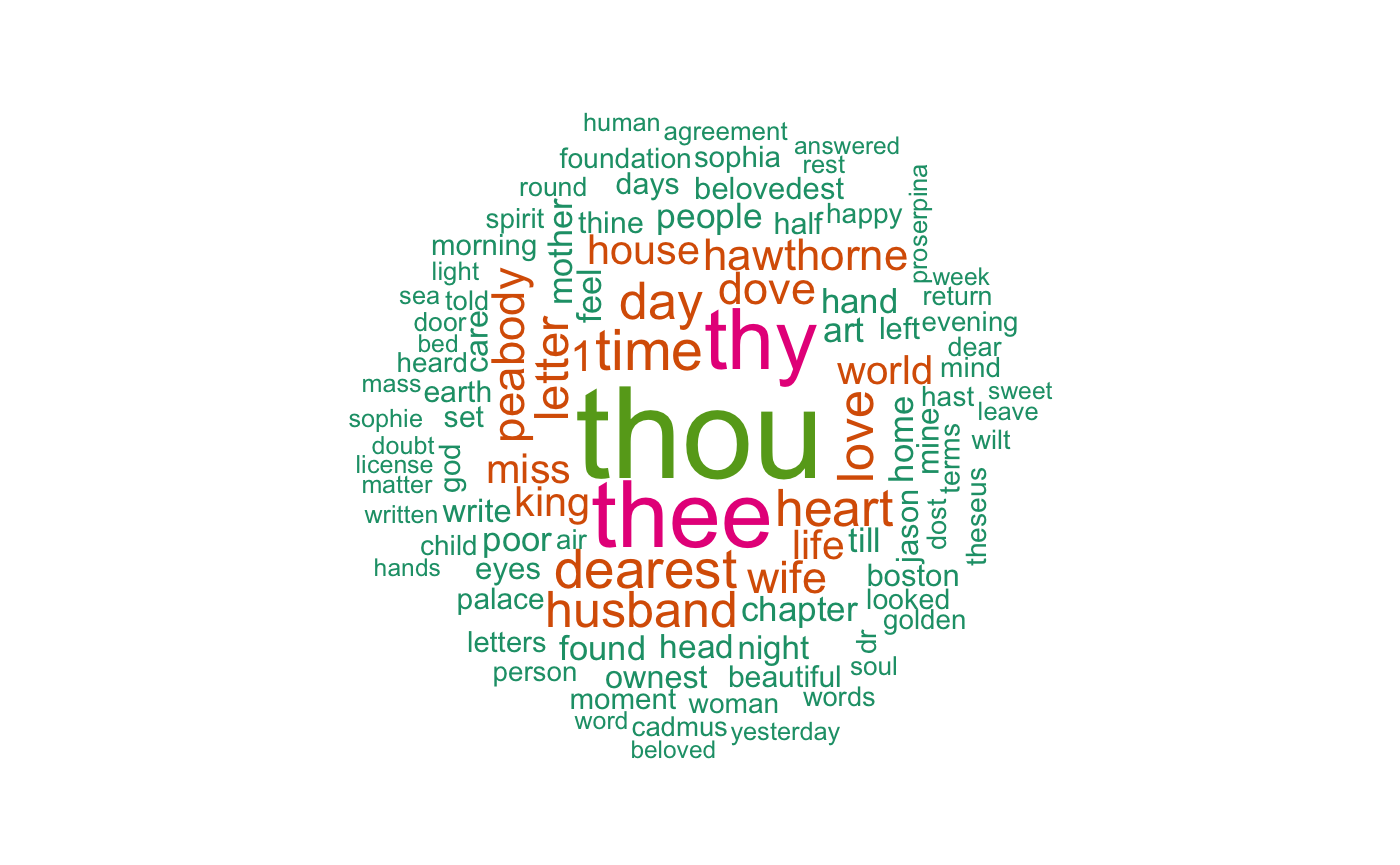
R
wordcloud
wordcloud()
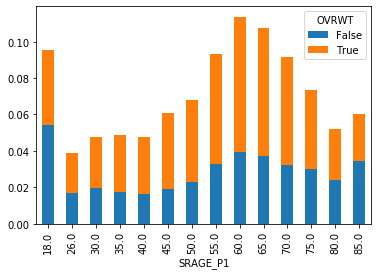
script
package
plot
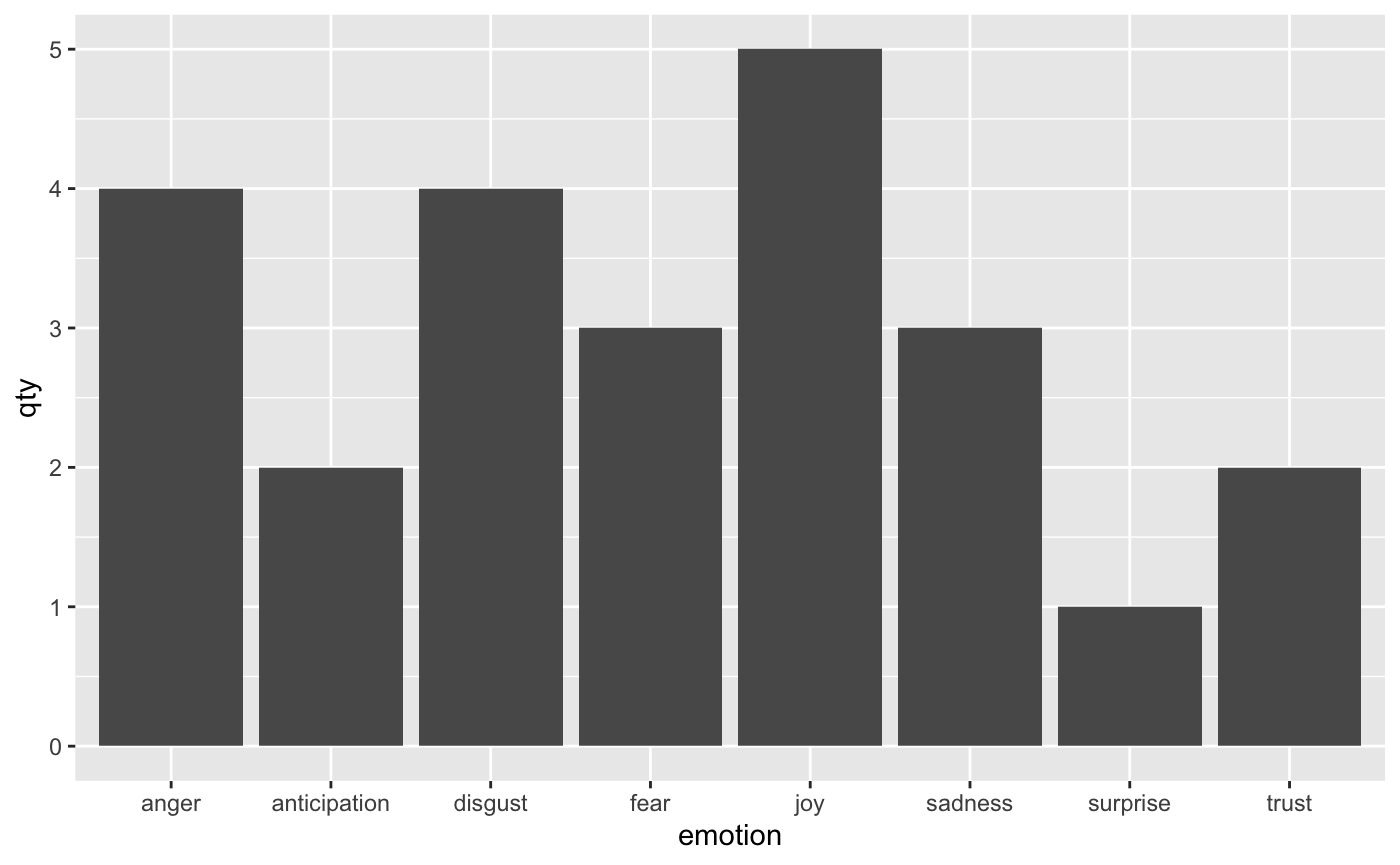
R
ggplot2
geom_col()
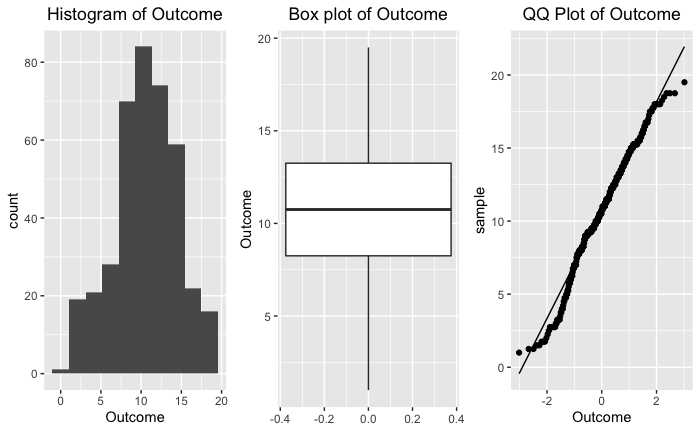
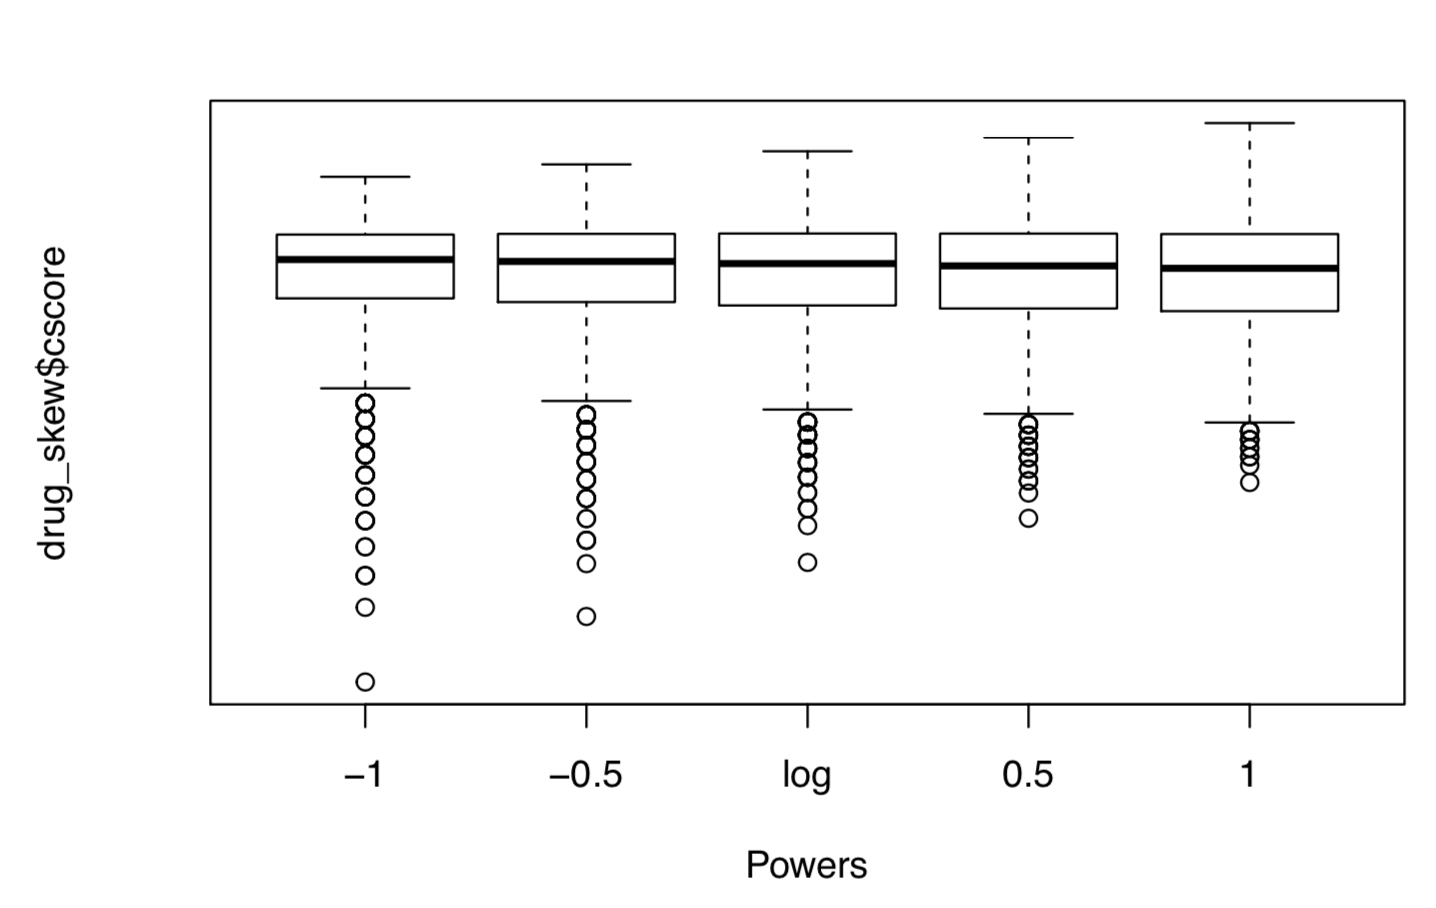
script
package
plot
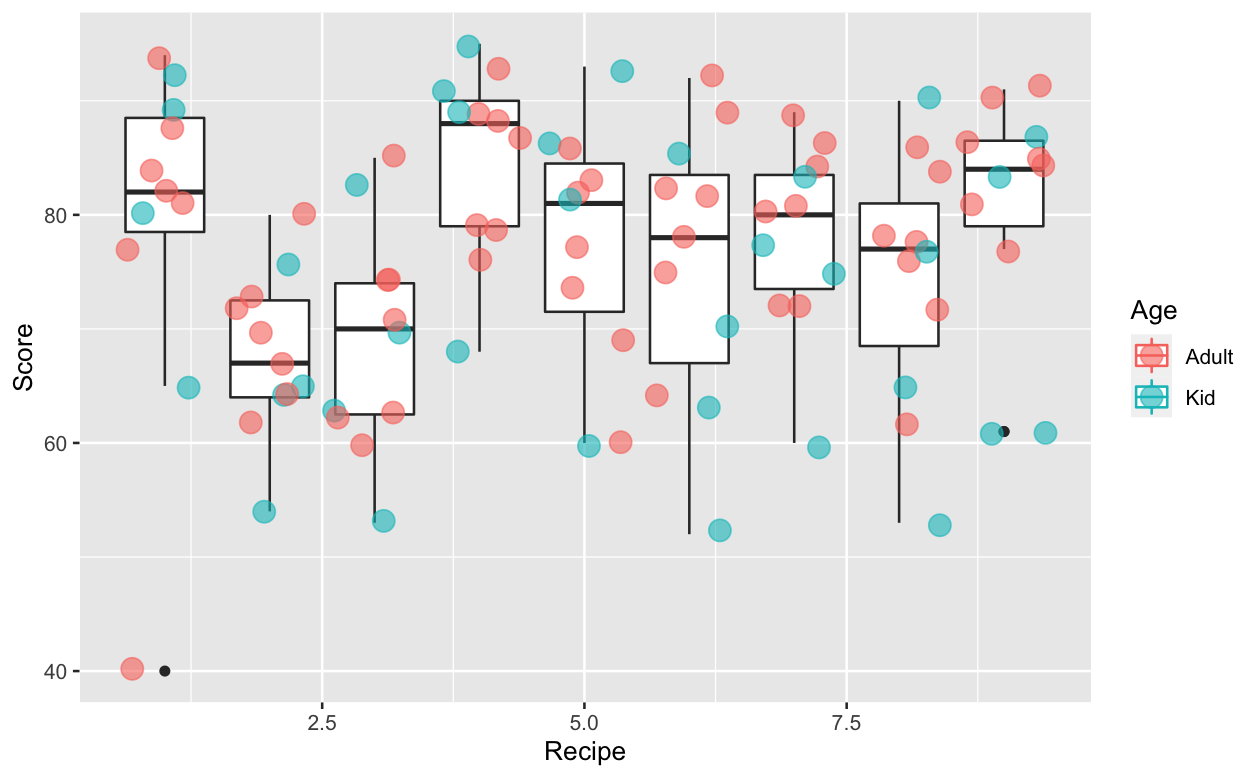
R
ggplot2
geom_boxplot()
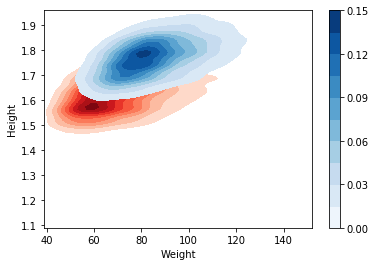
script
package
plot
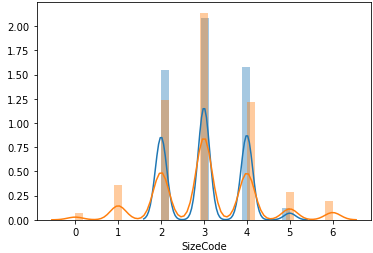
Python
seaborn
distplot()
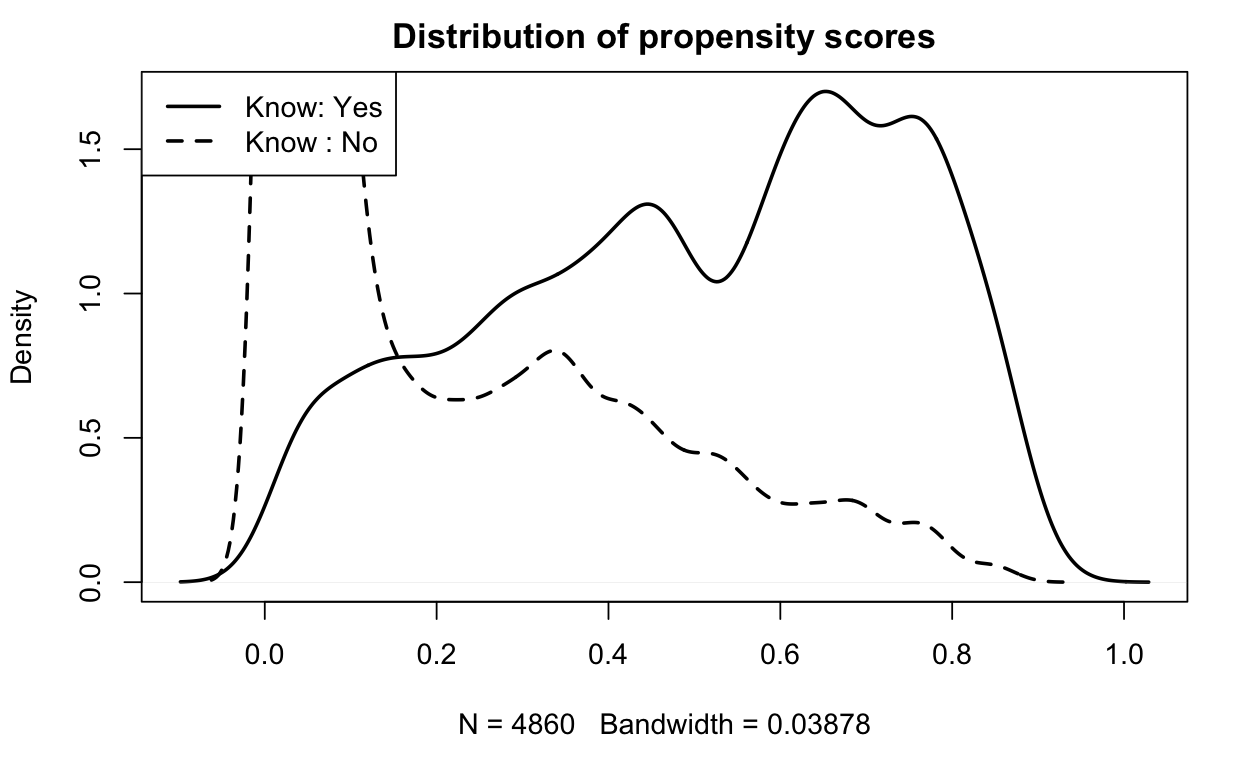
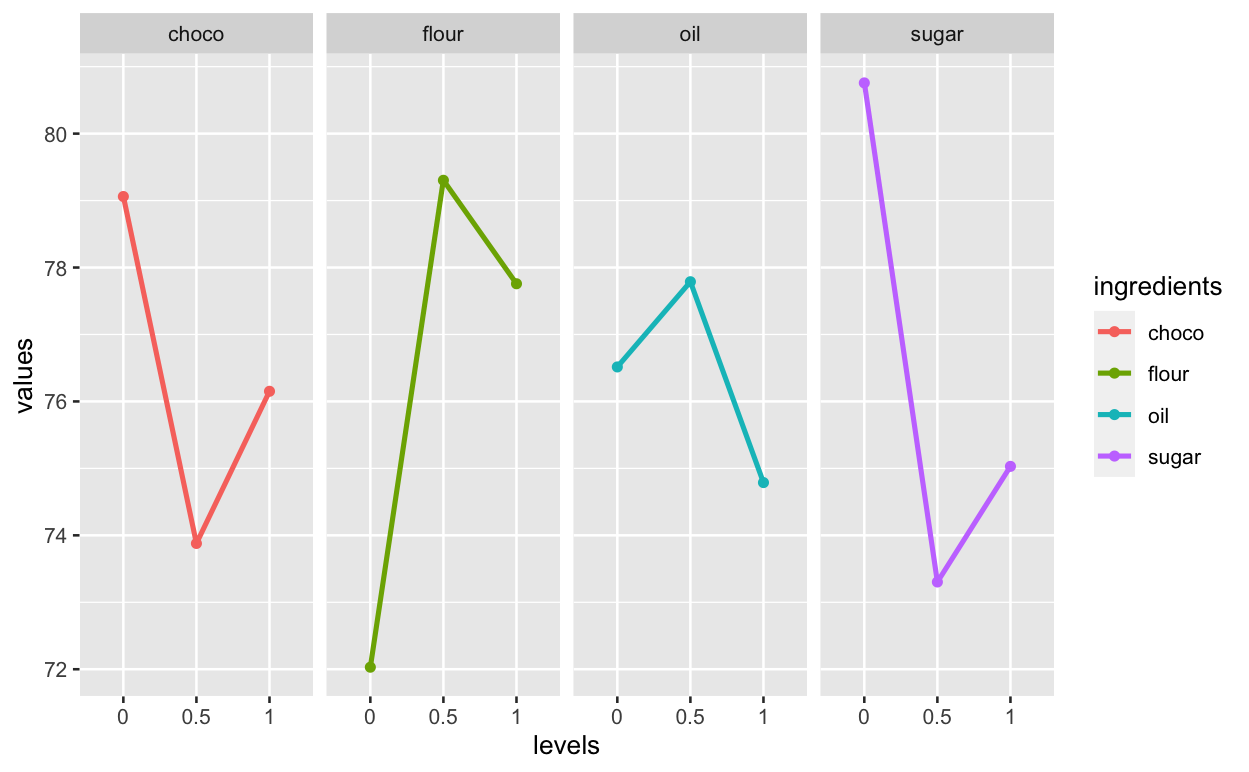
script
package
plot
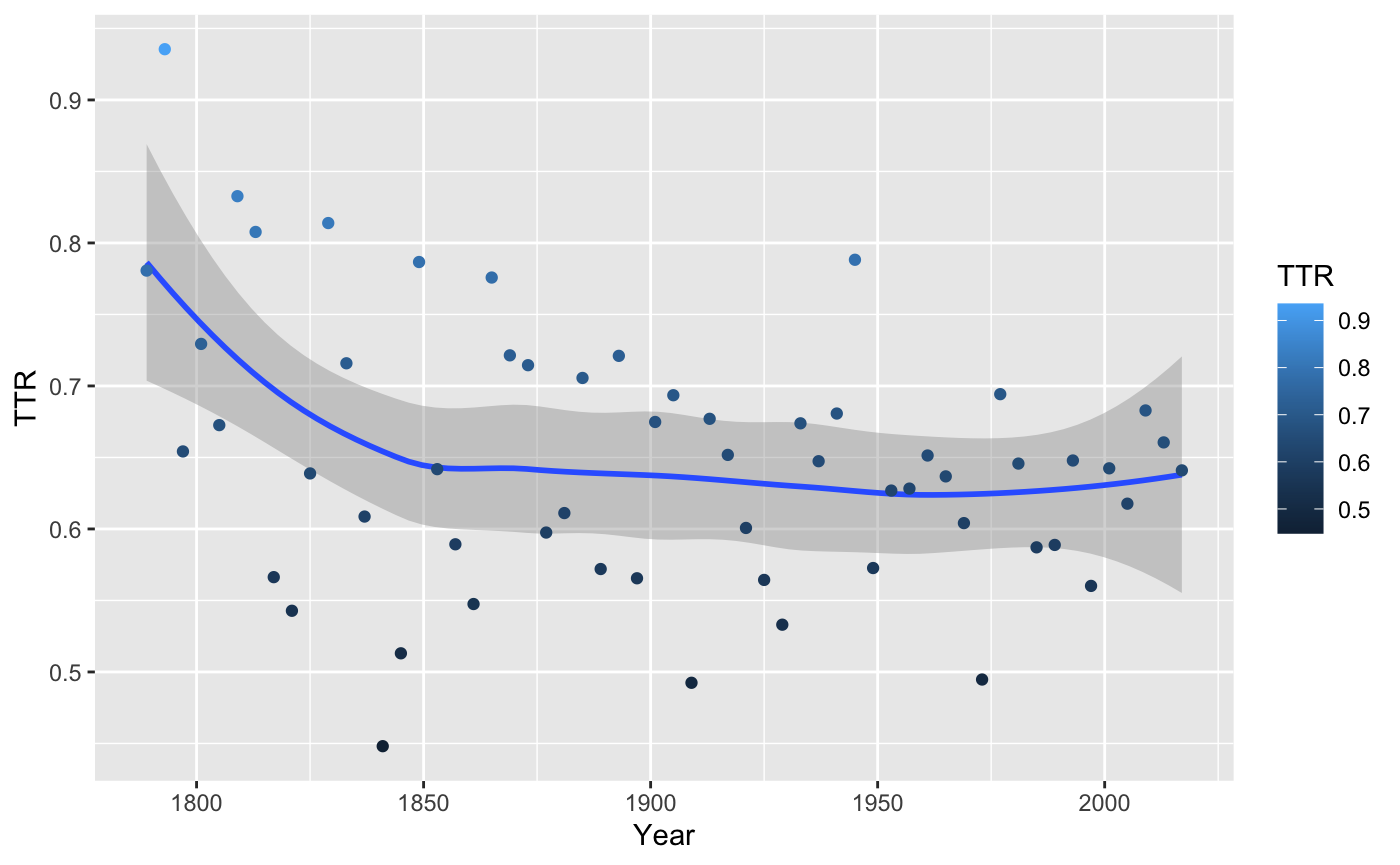
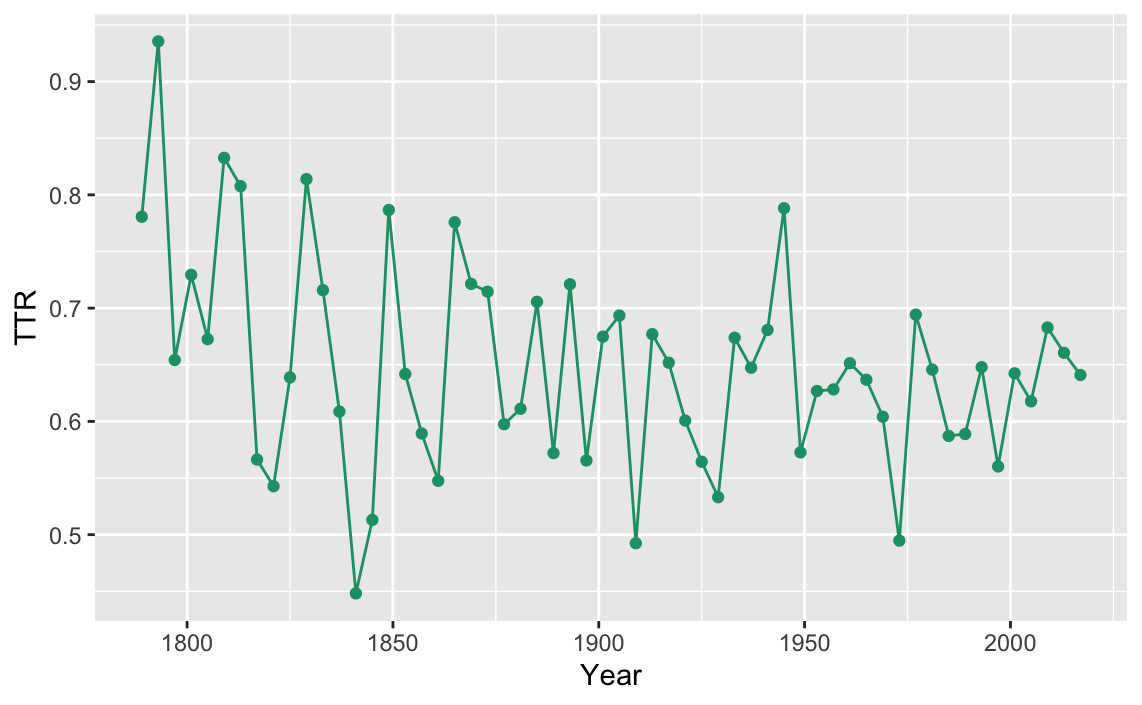
R
ggplo2
geom_line()